Since starting a new job tends to involve a lot of reflection on the prior one, I’ve spent some time recently thinking about my time at Twitter. While there were both good and bad parts, I generally feel like I had a few great opportunities to participate in product design and understand how even simple looking products tend to have a lot of hidden edge cases and adjustments to smooth those over.
I generally use the example of analytics.twitter.com. Superficially, this site has a very direct purpose–to show you numbers associated with your Tweets. But as my team started exploring a landing page which would show aggregated impressions, we found all sorts of cases which would surprise our customers.
For an example of this, it’s interesting to consider that for the purposes of reporting analytics, a given Tweet impression is associated with two timestamps. First is when the impression occurred, and second is when the Tweet which is being viewed was created (always before the impression, as you would expect). You can graph these two values, as I have below using simulated data:
Say you wanted to aggregate a set of impressions on a certain day. This would be represented by cutting a vertical slice in the graph and summing up the count of impressions inside that slice.
This is roughly equivalent to the monthly aggregation view in the Twitter Analytics home page. It represents the total number of impressions that month, but could include impressions from Tweets created before the period, and may not include every impression for a Tweet created within the period.
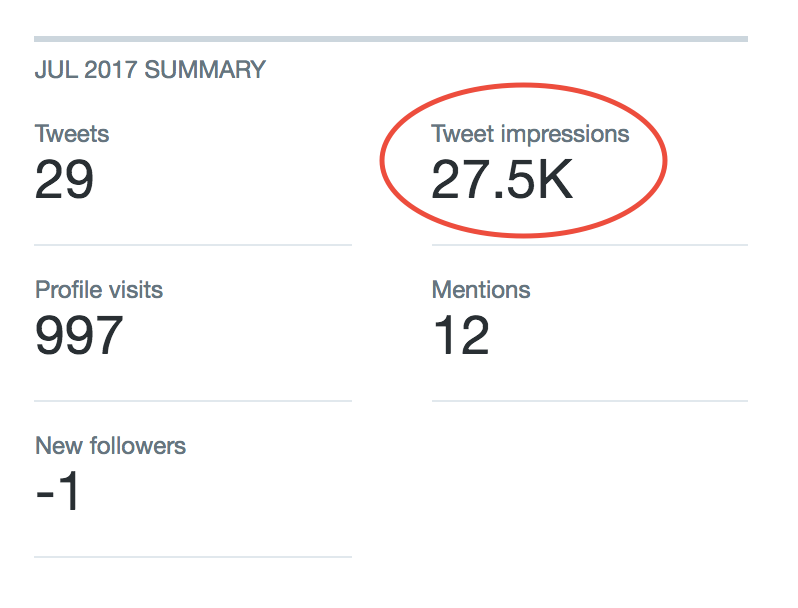
Turns out, this is not strictly what people expect if you say “Tweet impressions in July”. The intuition for many of our users was to select all the Tweets which were created in July and sum up the impression number for each. This was possible due to another feature our team built: all-time impressions on Tweet activity pages.
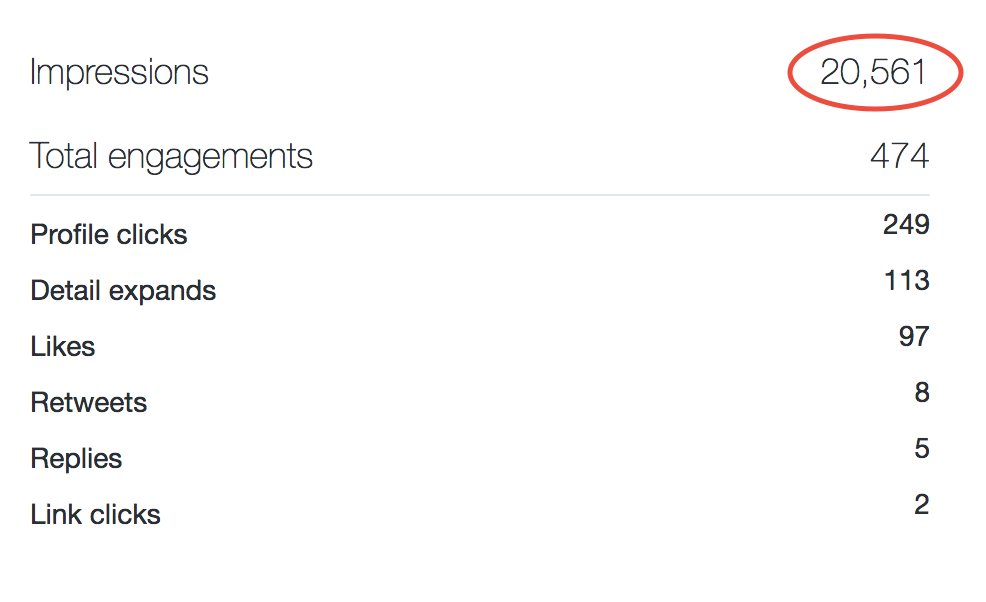
For a Tweet created in July, this count might include impressions which occurred in August or even later. So summing up this number for all Tweets in a given time range can be thought of as a horizontal slice in the Tweet impression graph:
Given these two methods of aggregation, imagine the method to select a “Top” Tweet for a given month. Selecting the maximum by either horizontal or vertical slice might return a Tweet created in the wrong month (this could easily happen if a Tweet was created toward the end of a month and got the bulk of its impressions in the following month).
One approach we considered was to take the best Tweet from the intersection of both horizontal and vertical slices. But if you look at the corresponding square in the chart below, you can see that this method biases for Tweets which occur toward the start of the period. A popular Tweet which split its impressions equally across two months may not be the top in either.
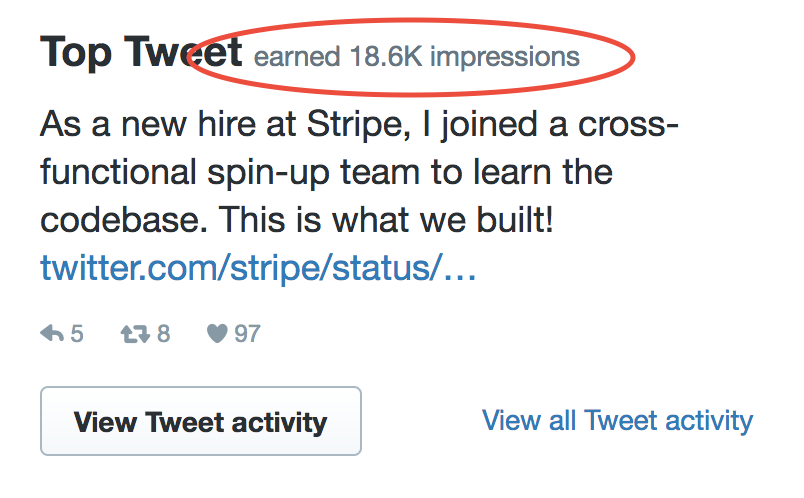
Eventually, we figured the least surprising approach was to return the Tweet which got the most impressions in the given month. Since this number is different from the all-time impression count, it is displayed as part of the Top Tweet UI:
Of course, this means that the Top Tweet in July might be a Tweet created in June, but we figured our users would understand. When we tested this with various accounts’ data it made sense, but highlighted another edge case–accounts which tended to Tweet less frequently commonly had the same Top Tweet for two months. Originally I didn’t think this would be much of an issue, but seeing it happen with real data changed my mind. It looked terrible, especially if multiple pairs of months on the same page shared the same Top Tweet.
I wound up implementing the Top Tweet endpoint in a way which returned a pool of candidate Tweets. The frontend would select the first Top Tweet which hadn’t already been displayed in the page. It was one of many cases where we elected to show less correct data in order to give a better user experience. Eventually we did the same thing with media Tweets too, in that your Top Media Tweet would never be a Tweet which was already your Top Tweet.
Of course, this kind of thing isn’t unique to Twitter, or analytics. One of my favorite examples is from Slack:
When Hacker News commenters say "I could build that app in a weekend!" I think of this chart of how Slack decides to send a notification. pic.twitter.com/LopicAyzkL
— Matt Haughey ❤️❤️💛 (@mathowie) March 3, 2017
Comments? If you have feedback, please share it with me on Twitter!